


Greenhouse gas emissions caused by production, use and disposal after one year
In 2012, the transport sector’s share in overall greenhouse gas emissions was 19.7% across the 28 member states of the European Union, making it the second-largest producer of greenhouse gases after the energy sector. To achieve the EU Commission’s climate protection targets for the transport industry, these emissions need to be lowered by 70% compared to 2008 values. The following will give an overview of how fuel-cell cars can mitigate greenhouse gas emissions in the EU up to 2050 and help achieve EU goals. The carbon footprint is the means by which to determine the potential for reducing those emissions. It describes the greenhouse gas emissions in CO2 equivalents across the entire product life cycle.
The calculation of greenhouse gas emissions by application is based on profiles of driving styles taken from the REM 2030 database created by the Fraunhofer Institute for Systems and Innovation Research [1]. The database contains profiles of 522 vehicles owned by commercial and industrial businesses. It puts the examined Mercedes B-Class in the Mid-Size Car category, which is why the study only includes driving style data of mid-size vehicles. With 55%, the mid-size car segment made up the biggest group of newly registered cars with commercial and industrial owners in 2012 [2], so the car category data used provides a good reference point for a company fleet.

To interpret the results and determine the potential reduction in emissions, the carbon footprint was also calculated for the Mercedes B-Class Electric Drive (a battery-driven electric car) as well as for the Mercedes B 180 CDI BlueEFFICIENCY Edition (a diesel version). Regarding the fuel-cell vehicle, there were three ways considered in the study to provide H2 supply: hydrogen separation from natural gas or wood and electrolysis through wind power as well as power from the EU electricity mix. The latter two supply the power for the electric car examined in the study. The amount of GHG emitted by using the different vehicles was calculated as shown in figure 1.
Greenhouse gas emissions caused by production, use and disposal after twelve years
The calculation results in a profile-based amount of greenhouse gas emissions per kilometer of driving. It includes 203 profiles of driving styles for mid-size vehicles taken from the REM 2030 database in order to calculate GHG emissions under various conditions. The data was used to determine the power required and based on this value, the total work generated. This makes it possible to estimate fuel consumption and, based on the type of car design and energy supply, the amount of greenhouse gas emissions.
The calculation of the required power considers rolling resistance as well as auxiliary power consumers, such as air conditioning and heating. Not included in the calculation was the resistance experienced through road inclination and acceleration, as well as the ambient air temperature. To determine the power one needs to apply, the required power is divided by vehicle efficiency, which is different for each vehicle. For the sake of simplicity, the efficiency value is viewed as being a constant in this scenario.
Influencing factors, such as road gradient, acceleration, temperature and variable efficiencies were greyed out, since they influence the calculated values but are not considered. To determine fuel consumption, the total work is divided by current vehicle speed. The result is multiplied by the greenhouse gas amount specific to this kind of energy supply.
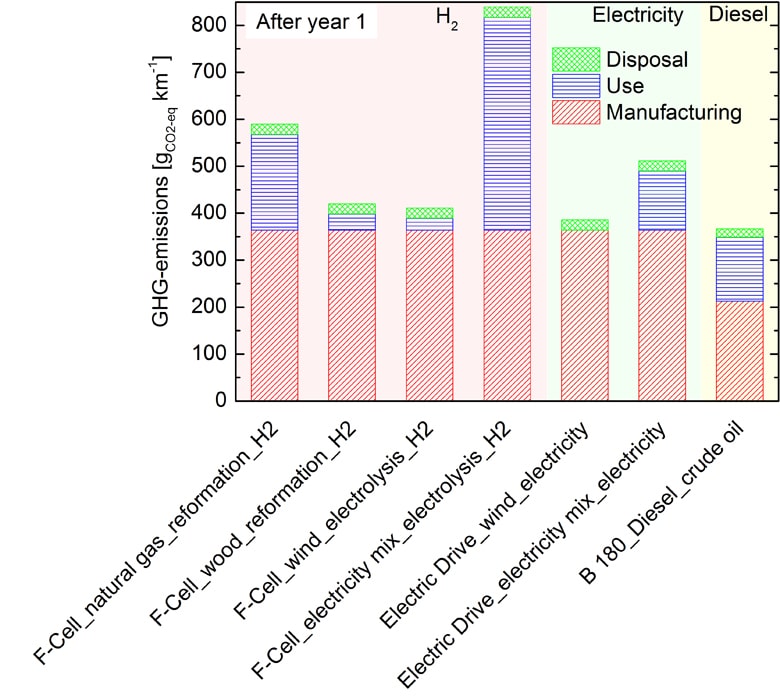
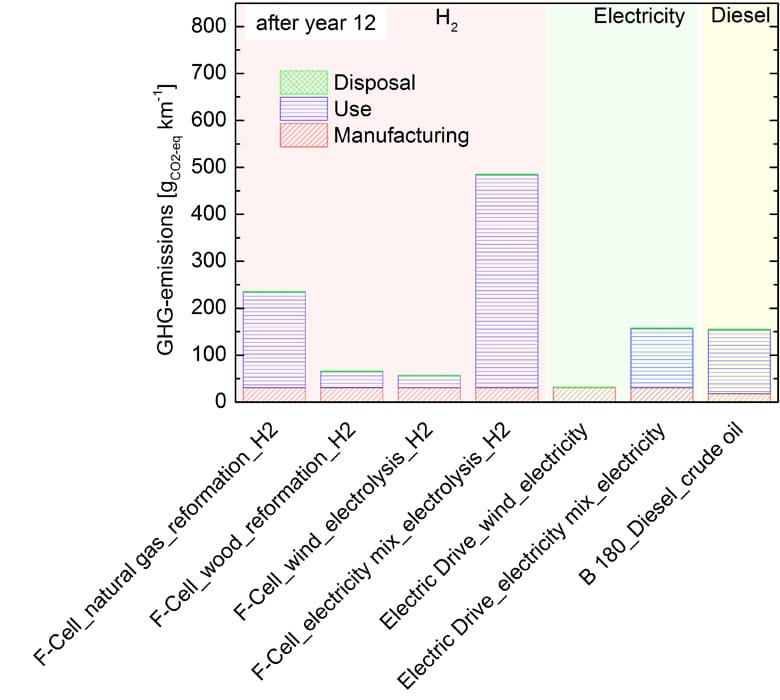
The method described above can be used to show the carbon footprints of different driving styles. This requires extrapolating the available data to one or twelve years. As the average examined profile restricts the life cycle to 8,000 hours in operation, based on the 2015 target described in publication [3], it is possible to use a Mercedes B-Class F-CELL for around twelve years. Figure 2 shows the GHG emissions across the product life cycle of different vehicles and means of supply after one and twelve years, broken down by production, use and disposal. The calculation assumes that the same amount of greenhouse gas emissions was produced to manufacture an F-CELL model and a Mercedes B-Class Electric Drive, since the UMBReLA study conducted by the Institute for Energy and Environmental Research Heidelberg (IFEU) showed the emissions for the manufacture of fuel-cell and battery-driven electric cars to be virtually identical. Another assumption is that there is a sufficiently large network of H2 refueling stations as well as enough fast-fill pumps to allow the inclusion of all driving styles considered in the study.
The GHG emissions produced are one part of the carbon footprint. The other concerns the emissions caused by the manufacture and disposal of vehicles and will be included in the balance across the entire product life cycle. The results are always based on the supposition that the lifetime is the same for the fuel-cell car and the two reference cars, independent of powertrain and storage technology.
With 5.9 tons of CO2 equivalent, the greenhouse gas emissions for the production and use of the diesel car are substantially lower than for the other two cars with 10.1 t CO2 equivalent [4]. The emissions caused by driving the car are determined through averaging the GHG emissions calculated per kilometer of the 203 mid-size car profiles. After one year, production still accounts for a large share of overall greenhouse gas emissions. After twelve years, the GHG share of production makes up only a twelfth of what it was after one. The longer the car is in use, the lower will be the share of greenhouse gas emissions from manufacture and disposal and the higher the importance of car utilization. The large influence of emissions from manufacturing means that the diesel car will have an advantage regarding its carbon footprint after one year because of the lower GHG output during production and disposal. After twelve years, car use has become the dominating factor regarding the carbon footprint, which shifts the advantage toward designs with fuels from regenerative sources. GHG emissions from fuel-cell car use are higher than from a battery-driven electric one because the fuel-cell car needs to convert electricity into hydrogen and because it has a lower vehicle efficiency.
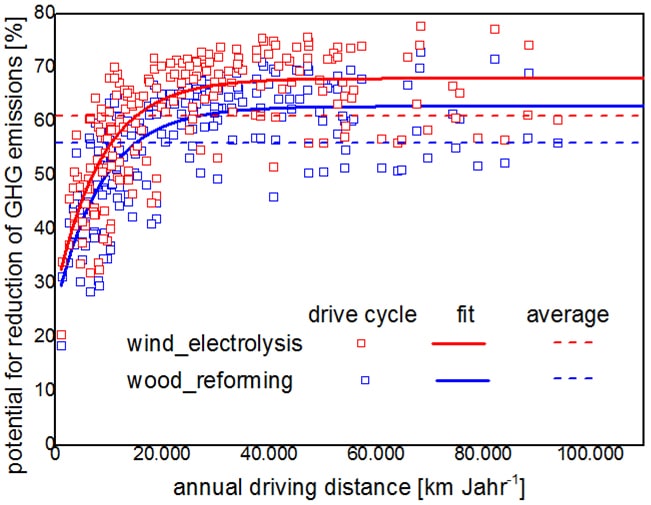
Emission reduction potential of Mercedes B-Class F-CELL with hydrogen from regenerative sources wood (blue) and wind (red) compared to a diesel reference car among 203 examined driving styles
Conclusion
The regenerative potential of hydrogen production to lower emissions for the 203 examined driving styles is shown based on the mileage per year (see figure 3). For each profile, there is the assumption that the maximum lifetime is reached after 8,000 hours in operation or after 27,200 stop-start cycles.
Assumptions regarding lifetime restriction were the same for the diesel reference car as for the Mercedes B-Class F-CELL. Vehicle life based on a certain driving style results in the maximum mileage over the vehicle’s service life. The comparison of reduction potential contains each of the 203 driving styles and refers to the yearly mileage of the examined profiles. Average reduction potential is exceeded at around 20,000 kilometers for both variants of H2 supply. Additionally, the dotted lines in the diagram show the average potential reduction of the 203 driving styles for both variants of H2 generation.
The reduction potential of the Mercedes B-Class F-CELL with hydrogen from wind energy is a bit higher than for hydrogen based on biogas. Some driving styles can achieve a reduction of nearly 80%. The difference in potential for the various profiles at the same yearly mileage can be explained by the difference in how the car is being driven.
As a conclusion, it can be said that hydrogen production from regenerative energy sources, primarily through the means of hydrogen generation examined here – electrolysis through wind power and hydrogen separation based on wood – shows great potential to significantly reduce GHG emissions by using fuel-cell cars. Especially since more than half of all commercially and industrially used vehicles have a mileage of over 20,000 km per year [5] and a considerable share of 62% of all new vehicles is registered by commercial and industrial owners [6], the potential of reducing GHG emissions is comparably high when using hydrogen to power vehicle fleets of businesses.
[1] REM 2030 Fahrprofile Datenbank, ed: Fraunhofer ISI, 2014
[2] Kraftfahrt-Bundesamt, Fahrzeugzulassungen 2013 nach Wirtschaftszweigen und Untergruppen und Fahrzeuggrößen, Kraftfahrt-Bundesamt, Flensburg, 2013
[3] B. Pollet, et al., Current status of hybrid, battery and fuel cell electric vehicles: From electrochemistry to market prospects, Electrochimica Acta, vol. 84, pp. 235-249, 2012
[4] Mercedes-Benz, Umweltzertifikat Mercedes-Benz B-Klasse Electric Drive, ed, 2014
[5] T. Gnann, et al., Elektromobilität im Personenwirtschaftsverkehr – eine Potenzialanalyse, Fraunhofer ISI, Karlsruhe, 2012
[6] Kraftfahrt-Bundesamt, Privat und gewerblich zugelassene Personenkraftwagen (Pkw) – der kleine Unterschied, 2012
All authors are working at Fraunhofer ISE, Freiburg:
Laura Sutor, laura.sutor@ise.fraunhofer.de
Nada Zamel, Ph.D., nada.zamel@ise.fraunhofer.de
Ulf Groos, ulf.groos@ise.fraunhofer.de


0 Comments